|
|
|
Manual
|
|
Panes
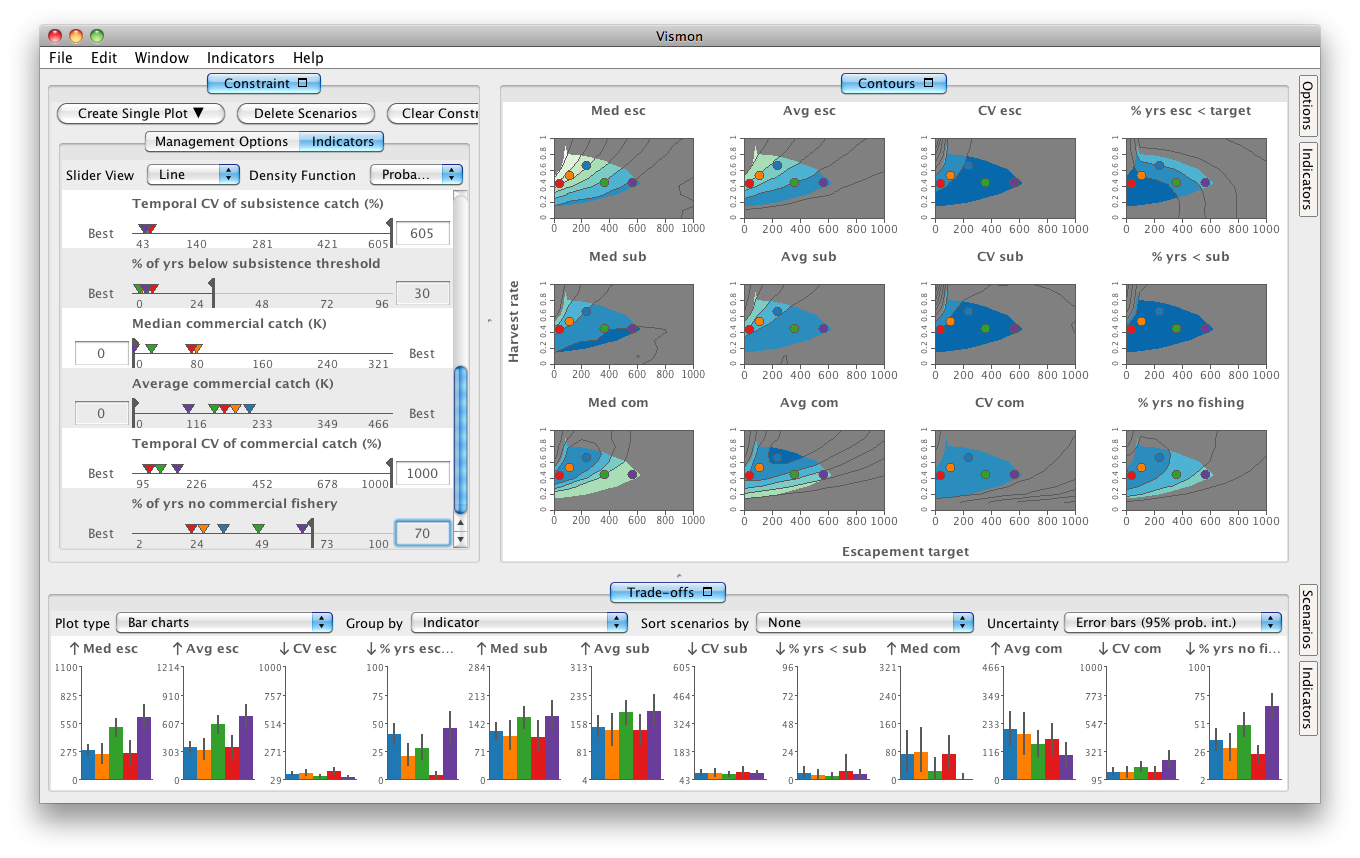
The Vismon UI contains three main panes as shown in this figure:
|
|
|
- Overview Pane:
The left pane summarizes all management options and indicators as read from the input file.
The Overview pane has two separate tabs for management options and indicators. It shows the individual management options and indicators as one-dimensional ranges. In both manegement options and indicators, the base small-multiple view shows a slider, with a moveable handle for quick interactive positioning and a text box for precise numerical entry when the user knows a value of interest in advance. The sliders allow the
user to restrict the active range of any input option or output indicator. The added constraint changes the shape of the permissible scenario region in the Contours pane plots.
Management options have bidirectional sliders with both a minimum and maximum handle, and two text boxes. Indicator sliders have only a single handle, since their directionality is known from the metadata. The label Best appears instead of a text box on the side that is the most desirable direction, and the handle also has a small flag pointing in that direction as a subtle visual cue.
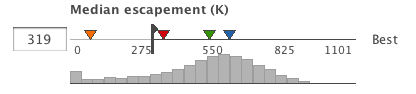
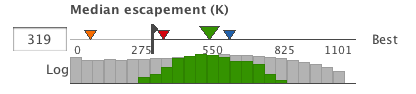
The plain sliders for the indicators convert to scented widgets on demand from the user to provide more information of the data. There are two choices that either or both of them can be shown:
-
MC Trials: It shows a histogram with the distribution of the average values for this indicator across all the Monte Carlo trials. In addition, the user can drill down even further by clicking on the triangle representing a scenario to view the distribution of the scenario values relative to the distribution of the full data set.
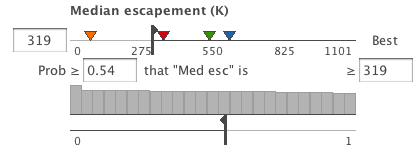
-
Probabilistic Objectives: allows the user to reason about all the Monte Carlo trials. It uses a two-part filter with a second slider and histogram. The second slider allows the user to set a probabilistic limit corresponding to the percentage of Monte Carlo simulation trials that are above that indicator limit for indicators that need to be maximized, or below for those that need to be minimized. The second slider allows the user to change this probability value interactively from the default of 0%, meaning that no possibilities have been ruled out, up to a higher number.
|
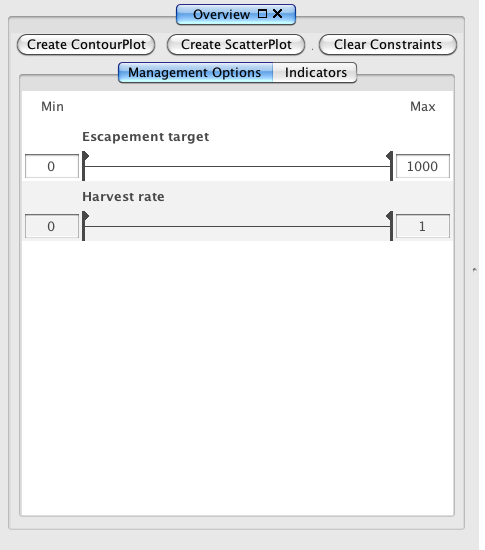
Management Option tab
|
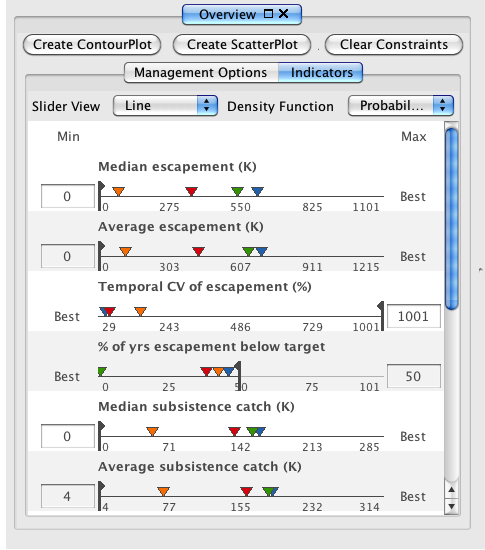
Indicator tab
|
|
|
|
|
|
Indicator slider, showing MC Trials
|
Indicator slider, showing MC Trials with a scenario triangle selected
|
Indicator slider, showing Probabilistic Objectives
|
|
- Contours Pane:
Contours pane, located on the right of Vismon main window, contains a contour plot matrix that has one two-dimensional plot for each active output indicator. The contour plots are colored by default with a sequential blue-white colormap that incorporates hue and saturation in addition to luminance in order to make the contour patterns highly visually salient.
- Trade-offs Pane:
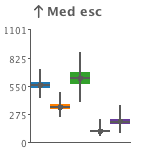
The Trade-offs pane, on the bottom, supports a detailed assessment of the trade-offs between a small set of scenarios with a set of small-multiple plots. The default plot type is standard bar charts.
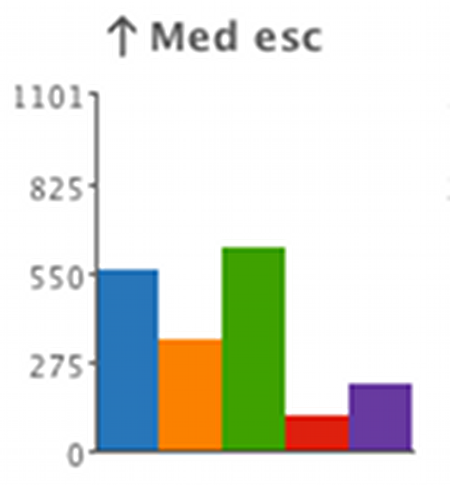
These plots support two kinds of analysis. The default mode is to group plots by indicator, showing one plot for each indicator with a different colored bar for each scenario. The opposite mode is to group by scenario, where each plot shows a single scenario with the bar heights showing all of its indicators.
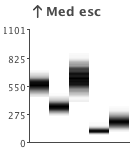
The plots support four different levels of showing the underlying uncertainty information.
- None: It shows plain bars with no uncertainty information at all.
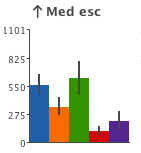
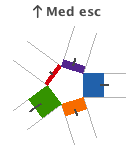
- Error bars: It superimposes a simple error bar showing the 95% confidence interval on top of the mark, summarizing the uncertainty with two additional values. This is the default option as it is very familiar to most scientists, and the high-lever information remains noticable.
- Box plots: In box plot mode the uncertainty is shown using a stylized box plot that shows the five statistical values of minimum, lower quartile, median, upper quartile, and maximum.
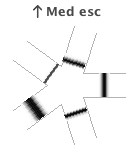
- The shaded distribution mode shows the uncertainty information in full detail by using a greyscale map that encodes the full distribution as normalized density.
The Trade-offs pane provides three possible plot types:
- Bar charts: Bar charts are the default plot type in this pane.
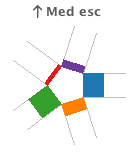
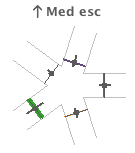
- Multipodes plot: The multipodes plot in is a radial alternative where the bars are laid out along a circle.
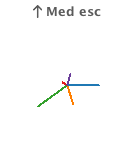
- Star glyphs: It is a simpler version of the multipodes plot that uses a one-pixel width mark instead of a wider bar. The reason for having this plot type is that it is already familiar with our fisheries collaborators.
|
|
|
|
|
|
|
Plain bar charts
|
Bar charts with error bars
|
Bar charts with box plots
|
Bar charts with shaded distribution
|
|
|
|
|
|
|
|
Plain multipodes plot
|
Multipodes plot with error bars
|
Multipodes plot with box plots
|
Multipodes plot with shaded distribution
|
Star glyphs
|
|
|
Menus
The Vismon UI has three main menus:
- File:
- Open Data:
Opens a data file.
- Open Recent Data:
Shows a list of recently opened files to select one to open.
- Open Project:
(Not implemented yet)
- Save Project:
(Not implemented yet)
- Save Project as:
(Not implemented yet)
- Export Windows to PNG:
(Not implemented yet)
- Export Scenarios to CSV:
(Not implemented yet)
- Exit:
Closes the program.
- Edit:
- Undo:
(Not implemented yet)
- Delete all Scenarios:
Deletes are created scenarios.
- Preferences:
Opens preferences dialouge, which controls the font sizes, and the percentage of confidence interval in visualizing error bars in Trade-offs pane.
- Window:
- Overview:
Shows/hides Overview pane.
- Contours:
Shows/hides Contours pane.
- Trade-offs:
Shows/hides Trade-offs pane.
- Visual Reference Lines:
Opens a dialouge with which the user can add/remove visual reference lines to the management option values.
|
|
|
|